Ellis Simmons · 2 October 2026
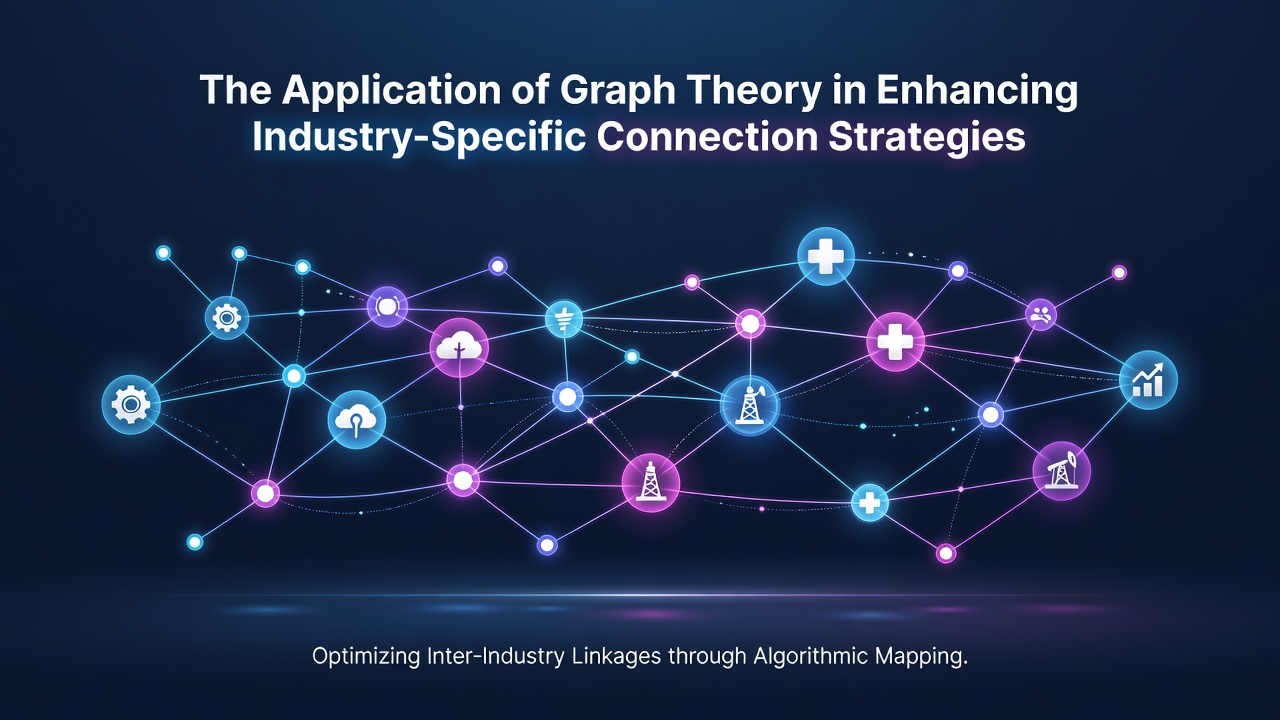
The Application of Graph Theory in Enhancing Industry-Specific Connection Strategies
Graph theory provides a mathematical framework for modeling relationships as networks of nodes and edges, and industries have applied these structures to map and optimize connections across supply chains, professional networks, and collaborative platforms. Researchers discovered that treating entities like companies or individuals as vertices and their interactions as links allows analysts to identify clusters, central hubs, and shortest paths that improve strategic decision-making in targeted sectors.
Core Concepts Driving Connection Analysis
Nodes represent key players such as manufacturers or service providers while edges capture transactions, partnerships, or communications, and measures like degree centrality reveal which participants hold the most direct ties. Betweenness centrality highlights intermediaries who bridge otherwise separate groups, whereas clustering coefficients quantify how densely connected subgroups form within larger systems. Studies from academic institutions show these metrics enable precise targeting of influential actors without exhaustive manual review of every relationship.
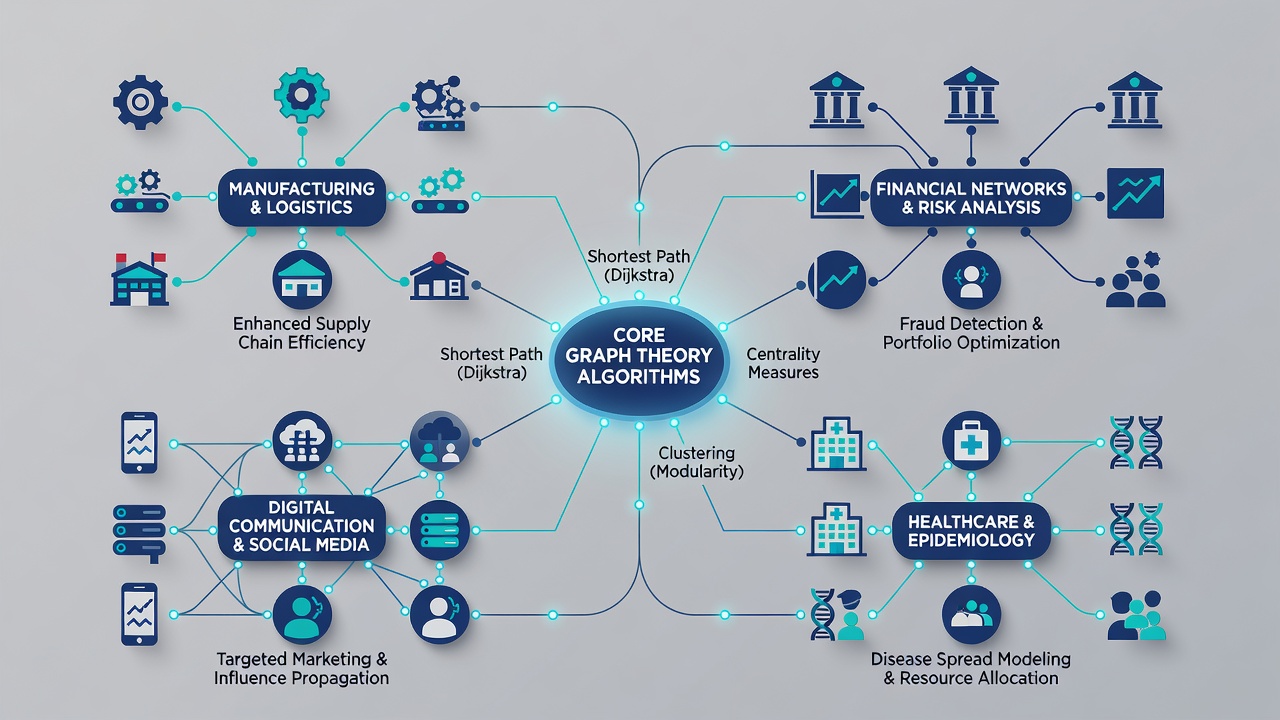
Algorithms such as Dijkstra's for pathfinding and community detection methods like Louvain modularity help process large datasets from industry databases. Observers note that when firms apply these tools to sector-specific data, patterns emerge that support refined outreach, resource allocation, and risk mitigation strategies. Data from multiple sectors indicates efficiency gains appear when connection maps replace traditional spreadsheets for relationship management.
Sector-Specific Implementations
In logistics and manufacturing, graph models treat warehouses and suppliers as nodes connected by shipping routes, and optimization routines minimize total travel distances while maintaining redundancy against disruptions. Figures from transportation authorities in Canada reveal that companies adopting these approaches reduced delivery delays by integrating real-time edge weight updates based on fuel costs and traffic conditions. Pharmaceutical supply networks similarly use graphs to trace ingredient flows and ensure compliance across borders.
Professional services and consulting fields map client histories and referral patterns as directed graphs, allowing firms to prioritize high-value bridges between industries. Research indicates that identifying nodes with high eigenvector centrality helps predict which contacts will generate sustained collaboration opportunities. Technology platforms apply similar techniques to developer ecosystems where open-source contributions form edges that signal expertise and potential team formations.
Integration with Emerging Data Sources
By October 2026 analysts expect expanded use of sensor data from IoT devices to dynamically update edge attributes in real time, turning static maps into living representations of industry activity. European regulatory bodies have published guidelines on data interoperability that encourage standardized graph formats for cross-border supply visibility. Australian research centers reported successful pilots where graph-based dashboards flagged potential bottlenecks weeks earlier than legacy systems during commodity price fluctuations.
Machine learning layers now combine with graph neural networks to forecast connection strength based on historical patterns, and organizations in the energy sector apply these hybrids to match renewable producers with storage operators. Evidence from collaborative projects shows accuracy improves when models incorporate both structural properties and external variables like regulatory changes or seasonal demand shifts.
Measurement of Strategic Outcomes
Performance indicators derived from graph analysis include network density before and after interventions, along with changes in average path length that signal faster information exchange. Industry reports document cases where targeted edge additions increased overall connectivity scores by measurable percentages, correlating with higher contract renewal rates in service fields. Those who track these metrics over multiple quarters observe consistent advantages in identifying emerging partners ahead of competitors.
Security applications extend the same principles to detect anomalous connection patterns that might indicate supply chain vulnerabilities or compliance risks, and government agencies in Asia have funded tools that visualize these anomalies across national industry graphs. The approach remains scalable because parallel computing frameworks handle graphs containing millions of nodes without proportional increases in processing time.
Conclusion
Graph theory continues to supply industries with structured methods for analyzing and strengthening targeted connections through quantifiable network properties and algorithmic insights. Organizations that embed these techniques into existing workflows gain clearer views of relational landscapes across logistics, professional services, and technology ecosystems. Continued refinement through new data streams and computational methods points toward broader adoption in sectors seeking measurable improvements in partnership efficiency and resilience.